Intro to RStudio Interface
Intro to R, RStudio, RMarkdown
What is R, RStudio and RMarkdown?
R: is a programming language specifically designed for statistical analysis. R is open-source, and is developed by a team of statisticians and programmers in both academia and industry. It is updated frequently and has become the de facto industry standard. In the data science realm, alternatives to R include Python with the Pandas library, and Julia. In the statistics realm, alternatives include SAS, Stata, and SPSS.RStudio: is an Integrated Development Environment (IDE) for R. RStudio is also open-source software, and depends upon a valid R installation to function. RStudio as available as both a both Desktop and Server application. You can think of RStudio as the piece of software through which you can run commands, do data cleaning statistical tests, and run more complicated programs that you write in R code. RStudio also has functionality to combine the statistical processes with text, figures, etc. with RMarkdown (below).
RMarkdown: is a syntax for composing relatively simple documents that combine R code and text. R Markdown is an extension of markdown (a general-purpose authoring format) that provides functionality for processing R code and output. If you’ve used Stata or SPSS before, think about RMarkdown some combination of your statistical program / do file and the text features of Word where you would write up your results. Rather than doing them separately, cutting and pasting results into Word, you can do it all in the same file with RMarkdown. With RMarkdown, you can do both R code and include written text both in the same file, “knit” it (i.e., combine the pieces of the file together) into output formats like pdf, Word document, and HTML. Your homeworks will be completed in RMarkdown (.rmd files) and knit into a .pdf format.
The RStudio interface (i.e., what am I looking at on the screen and what do I do?)
In clockwise order, let’s talk through what’s going on in each of the quadrants of the screen
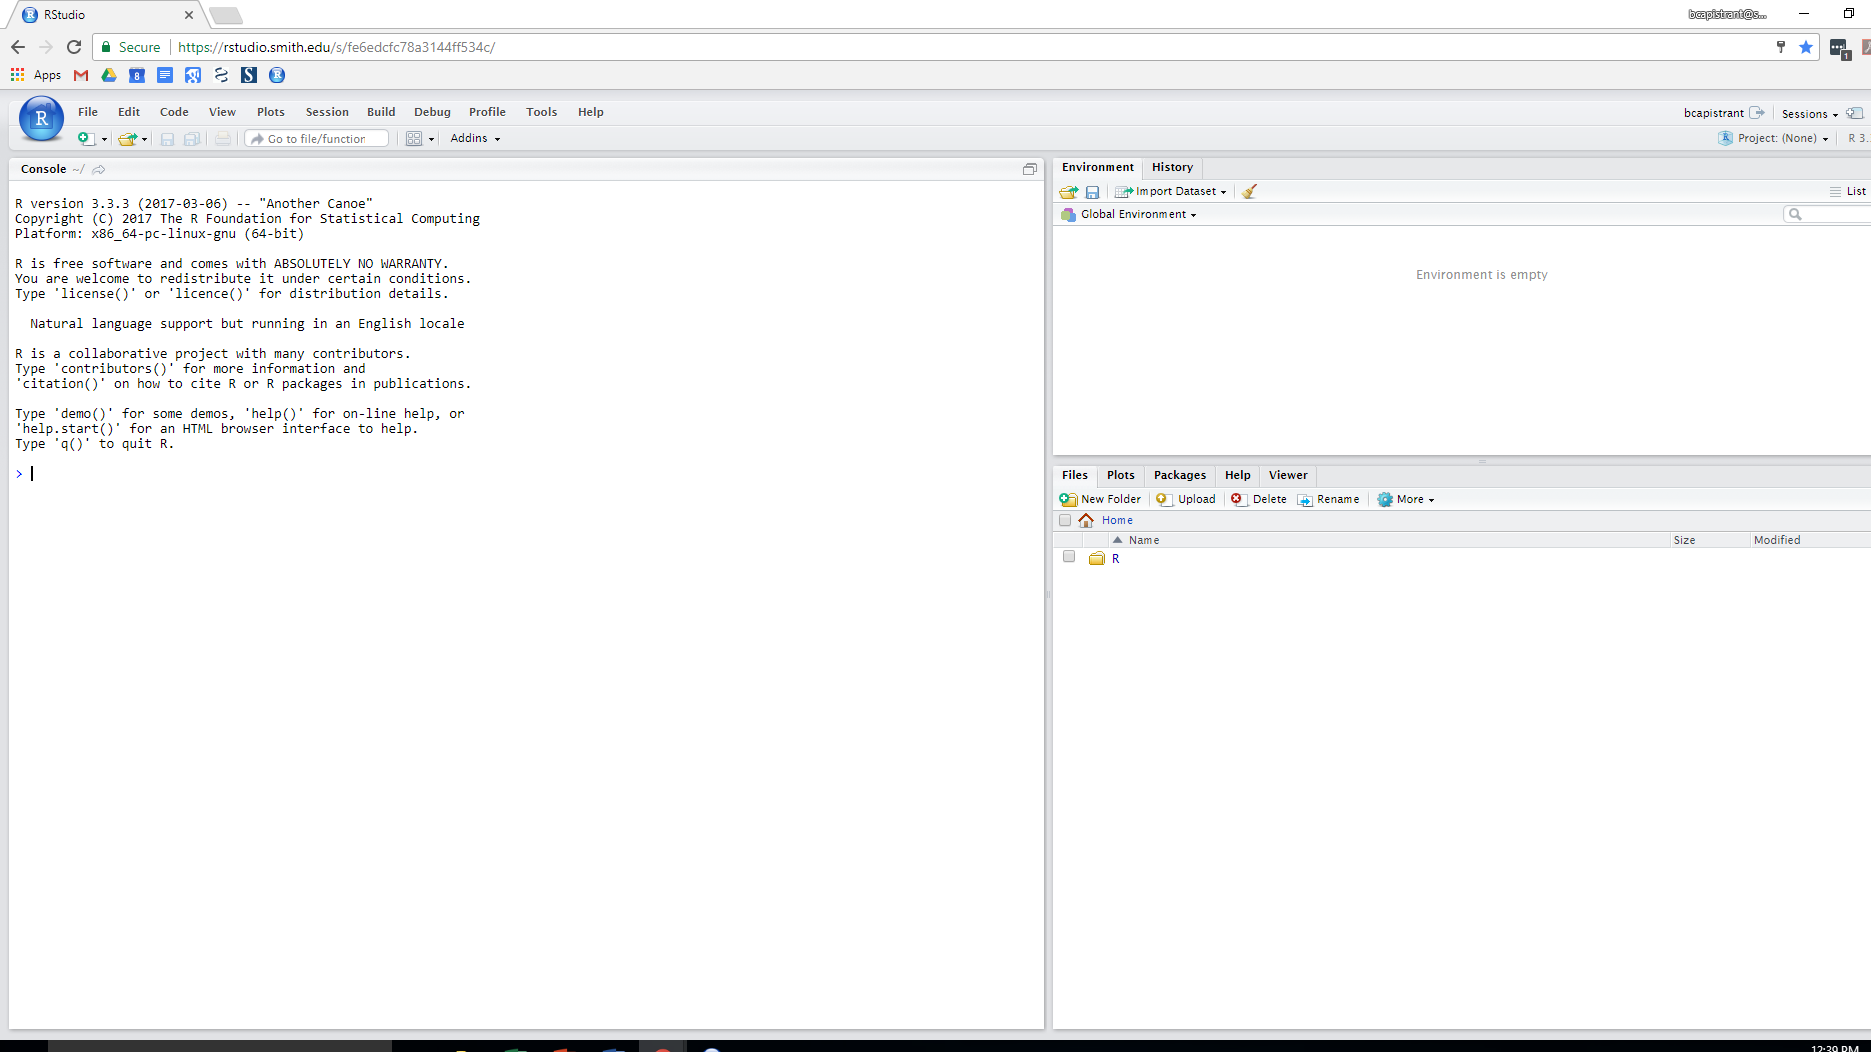
Upper Right: your environment
- This quadrant includes datasets, created variables, etc, and history shows all of the commands that you’ve previously entered.
Bottom Right: a bunch of very helpful tabs
- Files: anything you’ve uploaded to the server (datasets, markdown files) and the resulting files that you knitted together will be here
- Plots: any plots that you generate will show up in the panel in the lower right corner.
- Help: you can search here for help, to find commands, etc.
- Packages: the list of installed packages, such as packages to tell R how to make a graph, to fit a linear regression model. The textbook has a package that includes all of the datasets used in the examples – you can look to see if Stat2Data is listed
- Viewer: where output gets generated, including knitted files
Bottom Left / Left panel:
Initially, when you open RStudio, all that’s on the left is the Console. Every time you launch RStudio, it will have the same text at the top of the console telling you the version of R that you’re running. Below that information is the prompt. Initially, interacting with R is all about typing commands and interpreting the output. To work interactively (i.e., you type a command right after the >, press enter, and see the results), you can use the prompt.
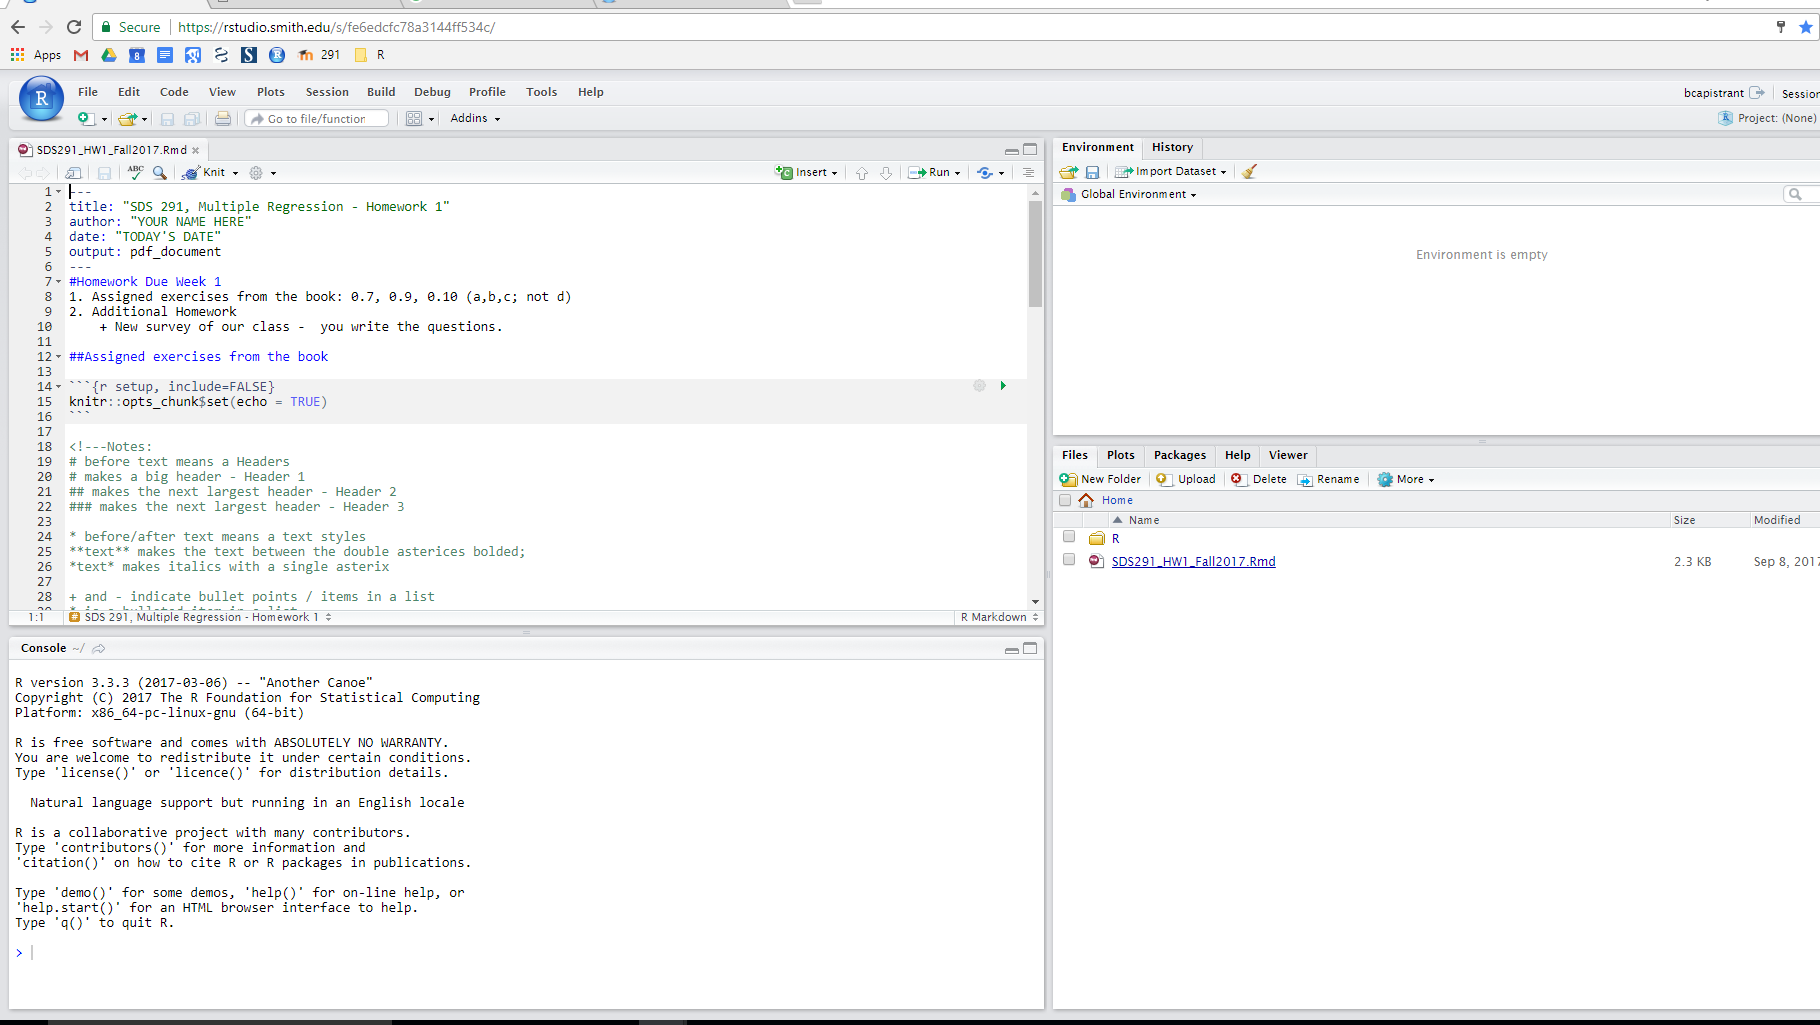
Upper Left: RMarkdown files appear here once opened.
We will be using RMarkdown, where you can write sections of code and text interspersed with one another in one RMarkdown file (.rmd). You can tell RStudio to run code in an RMarkdown file line-by-line, chunk-by-chunk (chunk is the highly technical R term for a section of code), or to “knit” the text and the results of the executed code in the RMarkdown file into one complete finished product. When you open RMarkdown files, they appear in the top left quadrant of the screen (in orange below), and the console moves down.
See an example below:
Note of thanks and attributions: This page was developed based on previously developed materials, particularly from Amelia McNamara and Andrew Heiss.